
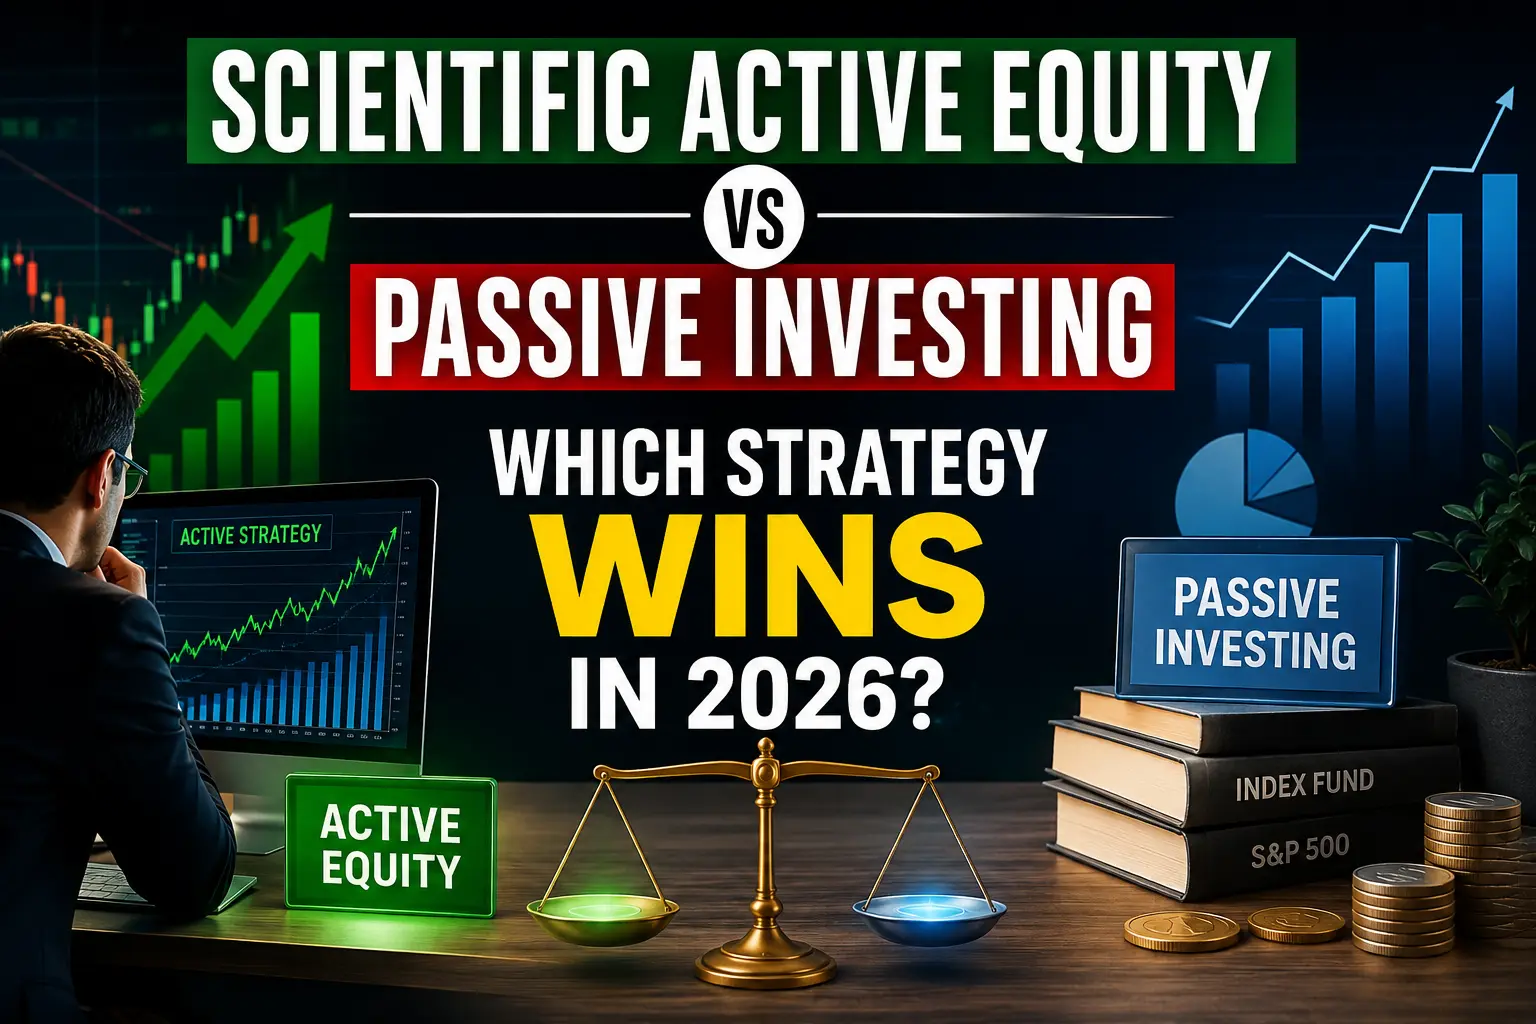
The short answer: Passive investing still wins on probability and cost — 79% of active large-cap U.S. equity funds underperformed the S&P 500 in 2025.
Over 10 years, just 21% of active funds survived and beat their passive peers.
The caveat:
2026 is different. Active ETFs now represent 80% of new ETF launches, and Goldman Sachs reports 57% of active mutual funds are beating their benchmarks in 2026 — well above the 37% historical average since 2007. Scientific active equity — using quantitative models, factor investing, and AI-driven analysis — is narrowing the gap.
The verdict for 2026:
Use passive indexing as your core foundation (70–80% of equity exposure). Add scientifically driven active strategies as satellite positions in areas where active management has an edge: small-cap, emerging markets, and fixed income.
Why This Debate Matters Right Now
Three forces are reshaping the active vs passive landscape in 2026:
1. Market concentration at historic highs.
As of March 2026, the top 10 companies represent nearly 40% of the S&P 500 Index. The “Magnificent Seven” alone comprise nearly 30% of the index. This concentration creates both risk and opportunity — passive investors are heavily exposed to a handful of stocks, while active managers can potentially navigate around this risk.
2. The active ETF explosion.
Active ETFs pulled in $459 billion** in net new flows in 2025 and have crossed **$1.47 trillion in assets, growing at a 59% compound annual rate. Active ETFs now account for roughly 80% of new ETF launches in 2026.
3. Methodological debates are heating up.
A new academic study sponsored by the Investment Adviser Association challenges the SPIVA methodology, arguing that when adjusted for asset-weighting and fund survivorship, 55% of active fund assets underperformed over 20 years — a coin flip, not the 92% SPIVA suggests.
Expert Insight: “I don’t treat passive and active funds as rivals,” says CFP Mike Casey, founder of AE Advisors in Alexandria, Virginia. “I treat them as teammates.”
What Is Scientific Active Equity?
Scientific active equity represents the evolution of traditional active management. Instead of relying on a portfolio manager’s intuition and discretionary stock-picking, scientific active strategies use:
- Quantitative factor models — identifying significant drivers of stock prices (value, momentum, quality, size, low volatility) and constructing portfolios with positive exposure to these factors
- Machine learning and AI — detecting micro-variations, anticipating weak signals, and identifying market shifts with surgical precision
- Systematic, rules-based processes — following a defined investment thesis, data acquisition, backtesting, and strategy evaluation
Fidelity’s Enhanced ETFs, for example, follow a systematic approach designed as a “thoughtful alternative to passive investing”. SEI Investments launched the SEI QiM U.S. Equity Factor Allocation Active ETF (SEUS) in July 2026, combining dynamic factor allocation, active stock selection, and risk management.
The key difference: Traditional active management is discretionary — a manager decides what to buy and sell. Scientific active equity is systematic — a quantitative model drives decisions, removing emotional bias and reducing the “human error” factor.
The Data: Active vs Passive Performance in 2026
SPIVA Scorecard (Year-End 2025)
| Metric | Result |
|---|---|
| Active large-cap U.S. equity funds that underperformed the S&P 500 in 2025 | 79% |
| Active funds that underperformed over 20 years (equal-weighted) | 92% |
| Active ETFs that have beaten benchmarks over 10 years | 24% |
Source: S&P Dow Jones Indices SPIVA U.S. Scorecard
Morningstar Active/Passive Barometer (Year-End 2025)
| Metric | Result |
|---|---|
| Active funds that survived and beat passive peers in 2025 | 38% (down from 42% in 2024) |
| Active funds that survived and beat passive peers over 10 years | 21% |
| Active emerging-markets funds that beat passive peers in 2025 | 64% (up 42 percentage points) |
| Active bond funds’ 10-year success rate | 42% (highest among all categories) |
Source: Morningstar US Active/Passive Barometer
The 2026 Shift
| Metric | Result |
|---|---|
| Active mutual funds beating benchmarks in 2026 (Goldman Sachs) | 57% (vs. 37% historical average) |
| Active ETF assets (2025) | $1.47 trillion |
| Active ETF organic growth rate (2025) | 53% |
Source: Goldman Sachs, Morningstar
The Cost Factor: Why Fees Matter
The fee gap between active and passive remains significant:
| Strategy | Average Expense Ratio |
|---|---|
| Passive ETFs | ~0.10% |
| Broad-market index ETFs | As low as 0.03% |
| Active ETFs | ~0.69% |
| Active mutual funds | 0.50% – 1.00% |
Source: ETF.com
The compounding impact: A 0.60-percentage-point cost differential on a $100,000 portfolio over 30 years costs roughly **$200,000** in foregone compounded growth. Active managers must overcome this headwind before adding any value.
Pro Tip: When evaluating active funds, always look at net-of-fee performance — not gross returns. Morningstar’s data shows that cheaper active funds (lowest fee quintile) have a 31% success rate over 10 years, compared to just 17% for the priciest funds.
Where Active Management Actually Works
Not all markets are equally efficient. Active management tends to perform better in:
Where passive wins consistently: Large-cap U.S. equities — the most efficient, most researched market in the world.
The Persistence Problem
Even if you pick a winning active manager, can they stay winning?
The S&P Persistence Scorecard reveals a sobering reality: less than 1% of all domestic equity funds — including both ETFs and mutual funds — managed to remain in the top quartile for five consecutive years. Performance is often mean-reverting, with top performers frequently falling to the bottom half in subsequent periods.
The implication: Past performance is not a reliable predictor of future results — especially in active management.
Scientific Active Equity: The 2026 Game Changer
Scientific active equity addresses the persistence problem by removing human emotion and relying on data-driven, systematic processes. Here’s why it matters in 2026:
1. Factor Investing Is Maturing
Quantitative strategies now use sophisticated factor models that have been backtested over decades. Research from Princeton shows that incorporating regime-aware forecasts into factor allocation strategies significantly improves performance compared to passive factor investing.
2. AI and Machine Learning Are Transforming Alpha Generation
Systematic equity investors now use machine-learning models to exploit nonlinear effects in market data — patterns that human managers cannot detect. This represents a genuine edge that passive strategies cannot replicate.
3. The Active ETF Wrapper Changes the Economics
Active ETFs offer the same tax efficiency, intraday trading, and transparency as passive ETFs — but with active management. The cost gap is narrowing, and the tax-efficiency case for using active ETFs in taxable accounts is strong.
4. Blended Approaches Are Emerging
Goldman Sachs advocates for “Alpha Enhanced” strategies that offer a middle ground between passive and active — “a little active can go a long way”. Allspring Global Investments similarly believes that “an efficient global equity portfolio blends low-cost market exposure (beta) with skilled active management (alpha)”.
Practical Takeaways for U.S. Investors in 2026
Build a Passive Core
- 70–80% of your U.S. large-cap equity exposure should be in low-cost index funds or ETFs
- The S&P 500 is hard to beat consistently — accept market returns for the bulk of your portfolio
Add Active Satellite Positions
- 20–30% allocated to areas where active management has an edge:
- Emerging markets (64% success rate in 2025)
- Small-cap equities (38% success rate)
- Fixed income (42% 10-year success rate)
Prioritize Scientific/Quantitative Active Strategies
- Look for funds with systematic, rules-based processes — not discretionary stock-pickers
- Evaluate factor exposure — does the fund target value, momentum, quality, or other empirically validated factors?
- Check fee levels — even active ETFs are getting cheaper; avoid funds charging over 0.75%
Monitor Concentration Risk
- With the top 10 stocks representing nearly 40% of the S&P 500, consider active strategies that can underweight overvalued mega-caps
- Factor-tilted strategies can provide diversification away from index concentration
Think Long-Term
- Don’t chase short-term active performance — 2026 may be a strong year for active managers, but persistence is rare
- Re-evaluate your active holdings annually — if they consistently underperform their passive benchmark over 3–5 years, consider moving to passive
Comparison Table: Scientific Active Equity vs. Passive Investing (2026)
| Feature / Criteria | Scientific Active Equity | Passive Investing (Index Funds/ETFs) |
|---|---|---|
| Core Philosophy | Outperform the benchmark by systematically exploiting market inefficiencies, factor premiums, and pricing anomalies using data-driven models. | Match the benchmark’s return by replicating the index (e.g., S&P 500) with minimal tracking error. Accepts market returns (beta). |
| Decision-Making Process | Systematic & Rules-Based. Uses quantitative algorithms, machine learning, and factor models (Value, Momentum, Quality, Low Volatility) to select securities. Removes human emotional bias. | Replication. Strictly follows a pre-defined index methodology (e.g., market-cap weighting). Decisions are purely mechanical (buy when added, sell when removed). |
| Average Expense Ratio | ~0.69% (for Active ETFs) to 0.50–1.00% (for mutual funds). Costs are declining but remain a significant hurdle. | ~0.03% to 0.10%. Broad-market ETFs (like VOO or IVV) can be as low as 0.03%. The cost advantage is massive and compounding. |
| Long-Term Success Rate | ~21% (10-year success rate for surviving funds beating their passive peers, per Morningstar). <1% remain in the top quartile for 5 consecutive years (Persistence Scorecard). | 100% (by definition). Tracks the index minus the tiny expense ratio. Guarantees market returns over the long term. |
| 2026 Performance Snapshot | 57% of active mutual funds are beating benchmarks year-to-date (Goldman Sachs), well above the 37% historical average. Highly volatile year-to-year. | Benchmark average. Underperforms in years where the “Magnificent 7” dominate, but outperforms active in most historical rolling 10-year periods. |
| Handling Market Concentration | Can adapt. Can intentionally underweight overvalued mega-caps (which make up ~40% of the S&P 500) to avoid concentration risk, reallocating to undervalued mid/small-caps. | Forced to buy. Must hold the top 10 stocks at their maximum market-cap weights, exposing investors to significant single-stock concentration risk (e.g., 30% in just 7 stocks). |
| Risk Management | Dynamic. Employs sophisticated risk models (e.g., volatility targeting, drawdown controls) and can pivot sectors or factors quickly based on regime-aware forecasts. | Static. Risk is purely tied to the index’s standard deviation. No downside protection; you ride the full bear-market drawdown. |
| Tax Efficiency | Moderate to High. Active ETFs (newer) are highly tax-efficient due to the in-kind creation/redemption mechanism. Older active mutual funds have high turnover, generating capital gains. | Extremely High. Ultra-low turnover minimizes capital gains distributions, making them the gold standard for taxable brokerage accounts. |
| Transparency | Opaque to Semi-Transparent. Quantitative “black boxes” rarely disclose full proprietary algorithms or intraday holdings. Active ETFs offer daily holdings but the strategy remains complex. | Fully Transparent. Holdings are publicly known daily and follow simple, published index rules. Investors know exactly what they own. |
| Best Use Case (Portfolio Role) | Satellite Positions (20–30%). Best for less-efficient markets: Emerging Markets (64% success rate), Small-Cap (38%), and Fixed Income (42% 10-yr success). | Core Foundation (70–80%). Best for the highly efficient U.S. Large-Cap space. Provides cheap, reliable beta that is historically hard to beat net-of-fees. |
| The 2026 Verdict | The Innovator. The explosion of Active ETFs ($1.47T AUM) and AI-driven quant models is genuinely narrowing the performance gap, but high fees mean managers must work twice as hard to justify their existence. | The Benchmark. Remains the default winner on probability and cost. However, investors must actively manage concentration risk elsewhere in the portfolio. |
The “Takeaway” Snapshot
If you are investing in U.S. Large-Cap stocks, the table shows a clear win for Passive (higher probability of success, lower cost).
If you are investing in Emerging Markets, Small-Caps, or Bonds, the table tilts toward Scientific Active, provided you choose low-cost, systematic quant funds rather than expensive, discretionary stock-pickers.
The optimal 2026 strategy remains a “Core & Satellite” hybrid: Passive for the foundation, Scientific Active for tactical edges.
Conclusion
The scientific active equity vs passive investing debate in 2026 is more nuanced than ever. The data is clear: passive investing wins on probability, cost, and long-term consistency. But scientific active strategies — using quantitative models, factor investing, and AI — are creating genuine opportunities for outperformance in specific market segments.
Your next step: Review your current portfolio. Ask yourself:
- What percentage of my U.S. large-cap exposure is in low-cost passive funds?
- Am I overpaying for active management that isn’t delivering?
- Do I have exposure to emerging markets, small-cap, or fixed income where active has an edge?
- Are my active funds using systematic, scientific approaches — or are they relying on a single manager’s gut instinct?
The 2026 winning strategy: Passive at the core. Scientific active on the edges. And always, always watch the fees.
Sources & Further Reading
- S&P Dow Jones Indices SPIVA U.S. Scorecard (Year-End 2025) – PDF
- Morningstar US Active/Passive Barometer (Year-End 2025)
- S&P Persistence Scorecard
- Cremers, Fulkerson & Riley (2026): “How the SPIVA US Scorecard Understates the Performance of Actively Managed Mutual Funds“
- Goldman Sachs Asset Management (2026): “Shifting Paradigms for Portfolio Construction“
Disclaimer: This article is for informational and educational purposes only and does not constitute financial, investment, or legal advice. Past performance does not guarantee future results. All investments carry risk, including the potential loss of principal. You should consult with a qualified financial advisor or fiduciary before making any investment decisions.